
AIGA: HUE ARE YOU?
#HUEAREYOU uses HEX codes to differentiate the unique values of the designers in the community. This project is complete with a website that consists of a “Find your HEX code” quiz, a community page, and many interactions that reveal fun facts about the larger design community. In this project, I worked specifically to develop the concept as well as the visual language of our brand.

OVERVIEW
TEAM
ROLE
TIMELINE
HTML/CSS/JS
Tableau
Figma
Jenny Liu
Elysha Tsai
Gary Tang
Visual Designer
Experience Designer
Spring 2022, 5weeks
A data visualization website based off of
the AIGA 2019 design census highlighting
the differences and similarities within the creative community in America.
UI/UX DESIGN | DATA VISUALIZATION | BRAND IDENTITY | CONCEPT DEVELOPMENT
TOOLS


Despite intent being at the center of why and how we design, the design world is missing out on meaningful social and professional relationships founded on similar values.
Every designer brings something different to the table– various experiences, stories, and values. The type of work we are drawn to and enjoy making are all affected by this as well. However, there is little emphasis on making connections with other designers who share the same values as us, or maybe we simply don’t know where to begin. How do we as individuals stand in this large community of designers and where do we fit in?
PROBLEM SPACE
We translated 9,304 responses and 41 categories from the AIGA 2019 Census data into a fun and interactive experience, where designers can come together to identify and reflect on their values, all while communicating with other designers.
Just like colors, the variety of designers are endless. My team chose to use
the metaphor of colors for this very reason and also because working with HEX
codes in the design process is an experience any designer could relate to.
The 9,304 data points from the AIGA design census was turned into 400 possible HEX codes, which represents 400 possible ways to identify a designer, and 16
family groups (hue families) that cluster similar HEX codes that share the same
value together.
SOLUTION

We created a system that assigns a HEX code to each designer based off of HSL, the three numbers that make up a color.
Each HEX code is composed of three numbers (Hue, Saturation, Luminance). We assigned a meaning to each part that would be determined by the designer’s answers in the short quiz on the website. See below for more detail on the logic for each part.
THE LOGIC

Hue
We found 16 major themes in the original census data and used them to create 16 hue families.
When one takes the quiz, the system will sift through the designer’s answers and count how many answers are related to each theme. The theme with the greatest frequency will be decided as the hue for the designer, indicating that the designer cares about that corresponding theme the most. Since the hue dictates what family the designer will be, five questions out of a eight question quiz, is dedicated to find out what hue fits the designer best.

SATURATION
Saturation indicates if the designer leans more hopeful or pessimistic about the industry.
The quiz asks the designer what are the critical challenges the design industry faces. This question is allows the designer to choose as many answers as they wish. If there are more answers marked, then the system decides that the designer leans more pessimistic.
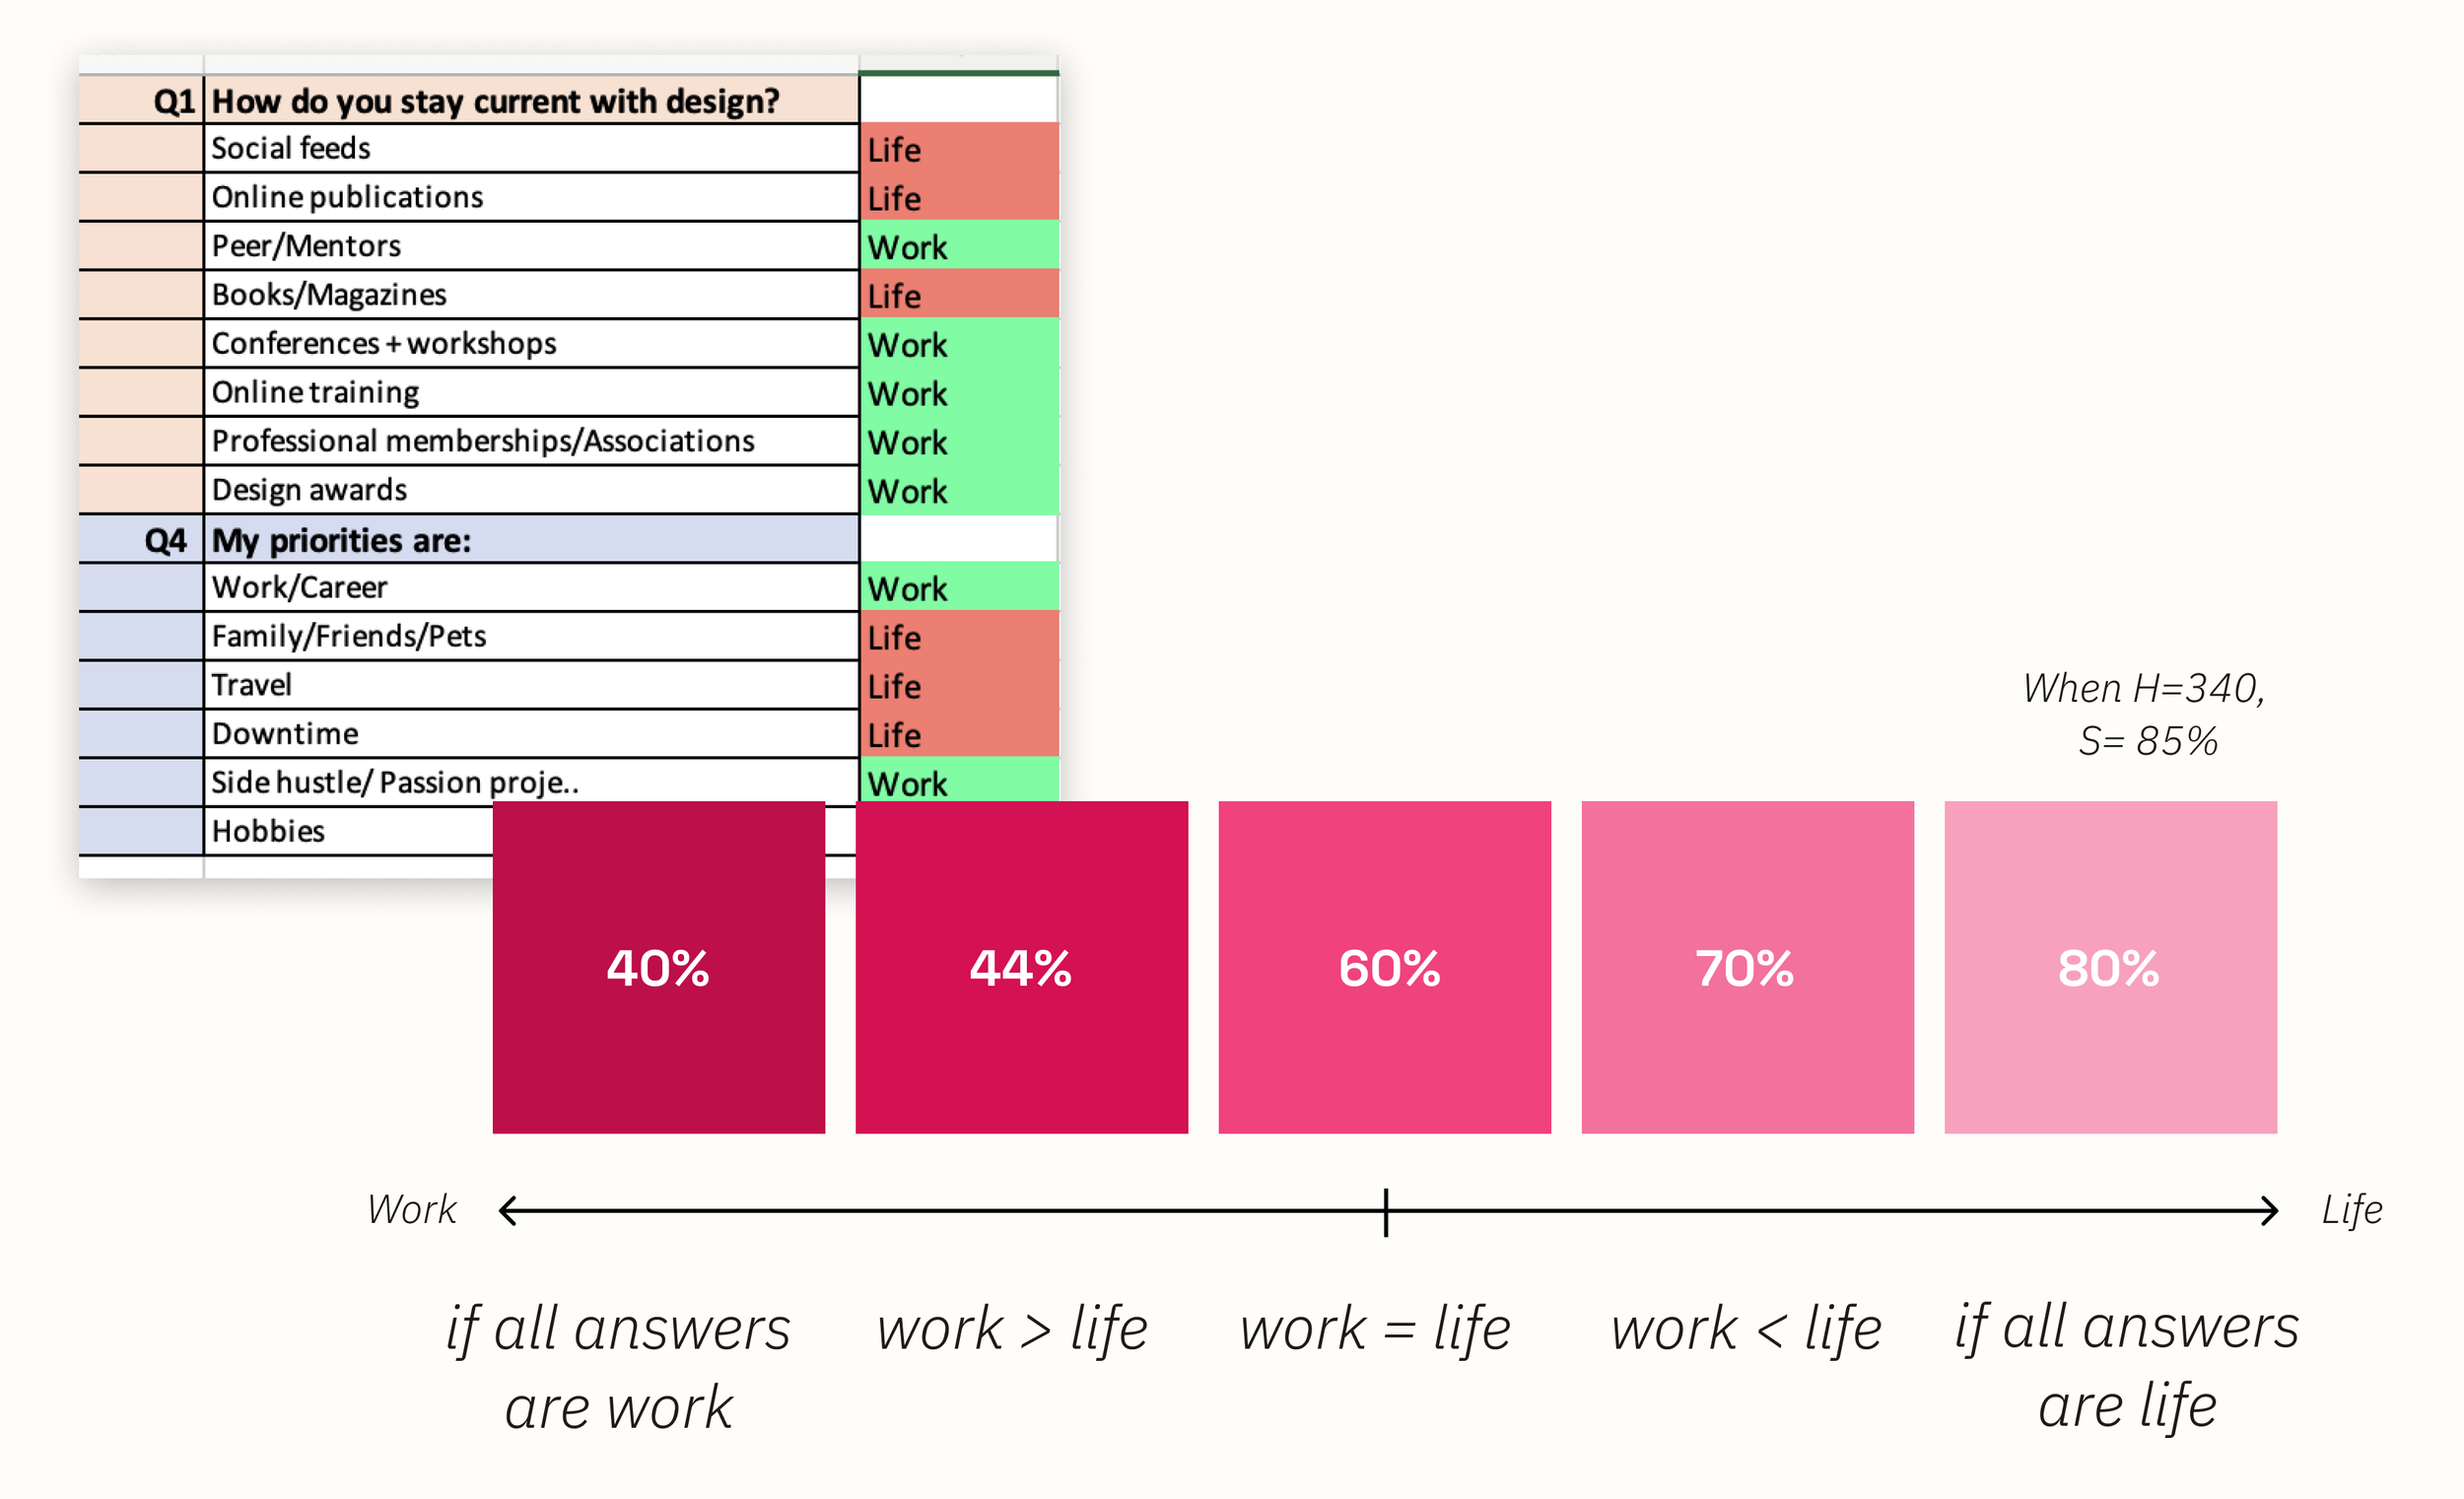
Luminance
Luminance deals with the designer’s work/life balance and what is more important to them.
Each answer choice was categorized to be either a ‘life’ related answer or ‘work’ related answer. The choice with more will affect the how light or dark the color would be.


After working through the logic, we consolidated 9,304 responses into 400 possible HEX codes and 16 family groups.
Interactive State
Default State
LANDING PAGE
Main navigation page of website
The explore page shows the landscape of the 400 types of designers derived from the AIGA design census data and allows users to explore what value each HEX code represents. Bigger squares indicate a larger quantity of designers that were categorized in that group, so at a glance, users are able to see what types of designers are more common in the industry.
Using the filter bar to explore
One card example from every hue family that informs the values/statistics of that HEX code.
EXPLORE page


Icons floating around the quiz are interactive and educational with fun facts about the design industry.

Every answer choice has a corresponding interactive card. The cards are either in 6 categories: facts, suggestions, quotes, percentage facts, and questions.
Incorporating other research findings at the bottom of the quiz for a fun, interactive, and educational moment
The 6 questions on the quiz were taken from the 2019 design census so that the results could be consistent with the rest of the community. Because the user’s HEX code is not yet determined, the quiz is kept monotoned to create anticipation for the color reveal.

QUIZ

After the quiz, the user gain context into where they fall within the greater creative industry.
The reveal of the hue family is welcomed with a famous designer quote.
On the results page, the designer is able to learn about the values of their family and the breakdown of their results. We matched the visuals of the results to the color HEX code
they were categorized into.

RESULTS
Applying our idea to our immediate community, the School of Design, here at Carnegie Mellon University.
After analyzing the different values and designers based off of the AIGA design census data, we were curious to see how our idea would apply in our school, here at Carnegie Mellon University. We were not only curious to see what our idea looked like scaled down but we simply wanted to know the types of designers that make up our school. We encouraged students and faculty to take our quiz and made a section in the website dedicated for the School of Design.
TAKING IT A STEP FURTHER

Actual Poster to gather research at Carnegie Mellon SoD

The School of Design landscape
Next time, I would put more consideration and be more wary about the categorization of people, especially moving forward in my other design research projects.
This project was one of the most complicated but rewarding projects I’ve contributed to during my years in college. One lesson that I learned from this project was how hard it was to accurately represent one person, in this case a designer’s values, and that I should be more wary of categorizing people into groups so quickly moving forward. I found that upon testing that although some of the facts associated with the HEX code were accurate, it was rare that a person was perfectly represented in our categorization. There were edge cases to a designer’s value that our quiz could not capture and moving forward I learned to pay closer attention to these things.
reflections and lessons learned